Pouet.net visualized
May 1st, 2011
This time in English, again, to serve the international readers 🙂 I wrote some scripts to leech the pouet.net database of productions (over 55000 of them!), after which I wrote a Processing sketch to count the statistics, and finally exported the output to NeoOffice to produce some graphs. The following visualizations should be taken with a grain of salt for a number of reasons, but nevertheless, they reveal some interesting developments.
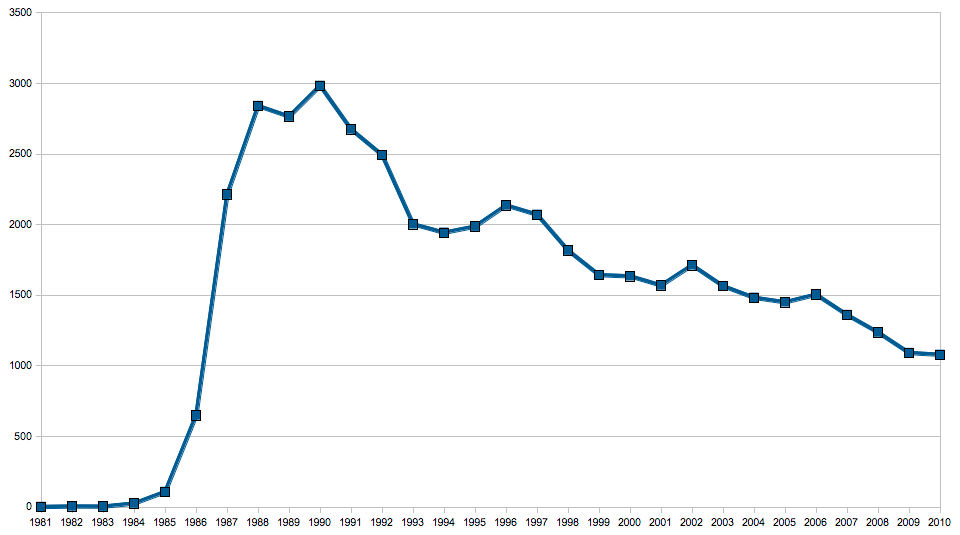
- Total number of productions per year – take a look at that peak in 1990!
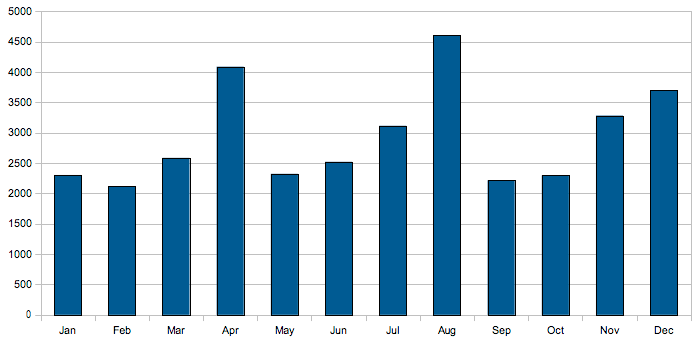
- Productions published each month – big parties clearly visible as peaks.
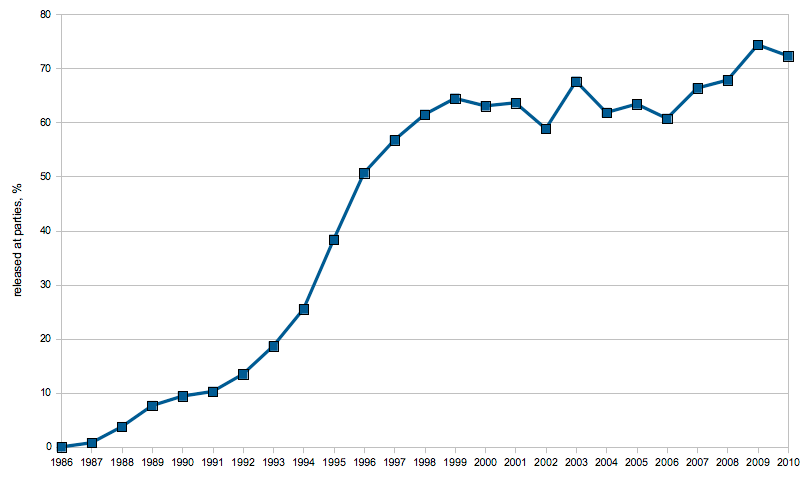
- The relative amount of prods published at parties by year – why bother if there’s no reward?
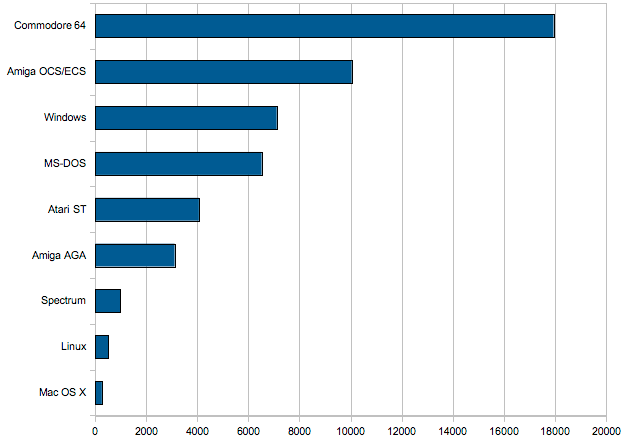
- Total number of productions per platform.
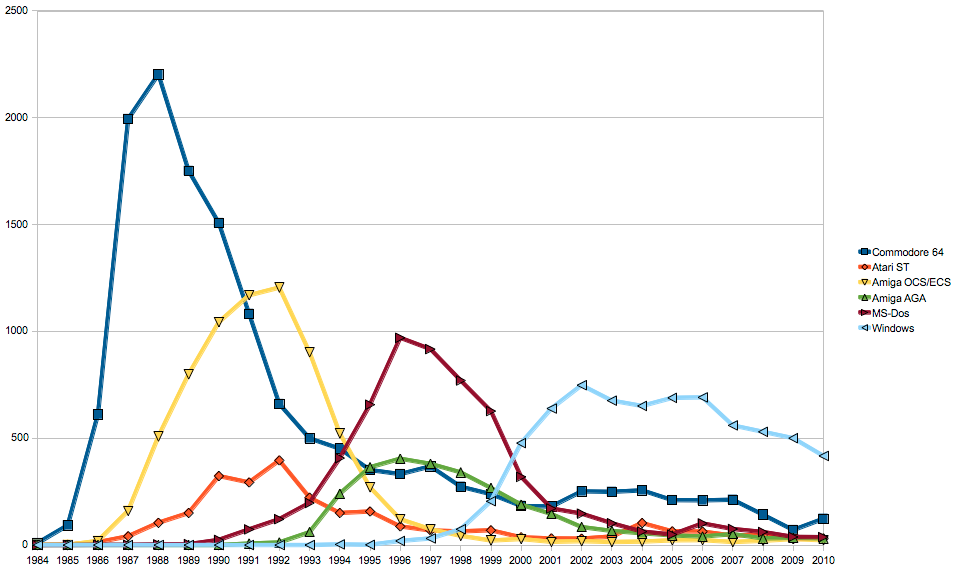
- The mother of all demo visualizations: productions per platform throughout the years!
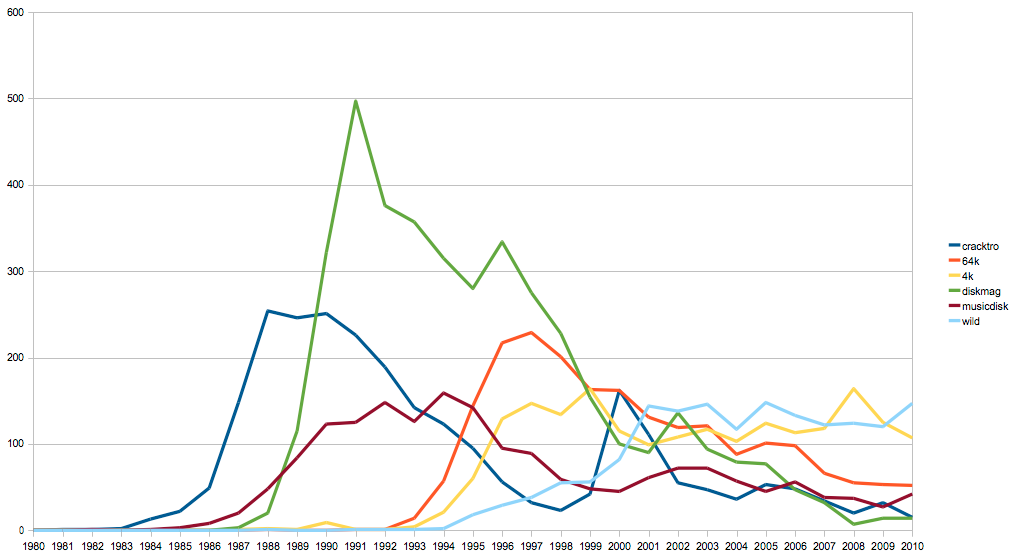
Edit: one more! Production types per year excluding demos.
8 Comments Add your own
1. pera | May 1st, 2011 at 9:48 pm
cool 🙂
2. Daniel Botz | May 1st, 2011 at 10:10 pm
That’s great!
I wanted to do something like this too, but didn’t know how. I made some small visualizations for my book and kind of extracted the tables manually (thankfully only for 8-bit/Console Demos which usually do not exceed 100 productions per year). Since I am not into scripting, I would appreciate some more details of how you accessed the pouet database.
And I definitely would be up to a bigger demoscene visualization project, if I can help.
-Daniel
3. marq | May 1st, 2011 at 10:37 pm
Here’s the script I used for getting each page with wget. extract.php is my own little php kludge that takes a html page and turns it into selected plaintext. I’m very willing to continue on this, as soon as I get more ideas on what to visualize next.
#!/bin/sh
n=1; while test $n ‘!=’ 2221 ; do wget -np \
“http://www.pouet.net/prodlist.php?page=”$n ; \
mv prodlist.php\?page\=$n `printf “%04d” $n`.html; n=$[$n+1] ; done
rm data.txt
for n in *.html ; do ../extract.php $n >> data.txt ; done
4. rare | May 3rd, 2011 at 2:40 pm
You might want to read this: http://pouet.net/faq.php#12
Besides that it look like the scene is dying. :'(
5. wullon | May 7th, 2011 at 3:45 am
Thanks for these graphs! Very interesting.
6. hedning | May 8th, 2011 at 1:27 pm
Very interesting charts! (sorry for writing in english, but my french sucks). I just want to point out one thing: Pouët is not a good resource for the c64 demo productions. CSDb (Commodore 64 Scene Database) is probably the best resource online if you want to have proper data for the charts regarding C64 demos. I would love to see an updated verion of the charts with data from CSDb.
Check it out: http://csdb.dk/
7. marq | May 9th, 2011 at 9:42 pm
Actually the Pouet.net database features CSDb stats too these days, there was some blood transfer at some point. And coincidentally, I just heard of this today: http://www.xentax.com/?page_id=235
8. Doreen | May 16th, 2011 at 1:53 pm
Thanks a lot for your visualizations – great work!
Kommentin kirjoitus
You must be logged in to post a comment.
RSS feed for comments on this post.